Insights & Innovations
Main navigation
Home
About
Tags
Computer Vision
Data and Api
Flutter and Dart
Lifes
Others
Security
Close Menu
Open Menu
Yolo를 이용해서 여러명의 얼굴을 모자이크 처리하기
December 8, 2025
나 빼고 다 모자이크 처리해야 하는데… 지난 시간에 배경제거 AI 모델을 이용해서 단체사진 속에 저의 사진을 합성해 봤는데요 결과...
더보기 →
U2Net VS Detectron2, 어떤 모델이 배경을 더 잘 지워줄까?
December 3, 2025
배경을 제거해야 하는 이유 얼마전에 저희 사회인야구팀이 우승을 했는데요. 처갓집에 가족들을 데리로 가야 할 시간이 다되어서 우승 사진...
더보기 →
OpenVPN 이용시 VPN 서버가 아니라 내 PC에 연결된 인터넷 회선을 사용하는지 체크하기
September 11, 2025
OpenVPN 서버가 클라우드 서비스에 설치되어 있다면? 만약에 여러분이 OpenVPN을 이용해서 가상 사설망을 구축했고 Open...
더보기 →
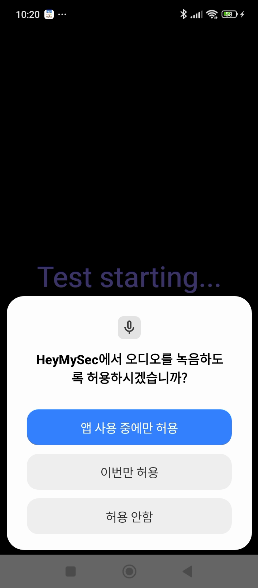
Flutter 통합 테스트 - Provider, STT를 사용하는 앱을 테스트 해봅시다
April 21, 2025
플러터 통합 테스트 안드로이드 네이티브 코드의 경우엔, 앱피움이라는 좋은 프레임워크가 존재합니다. 그런데 플러터를 앱피움으로 테스...
더보기 →
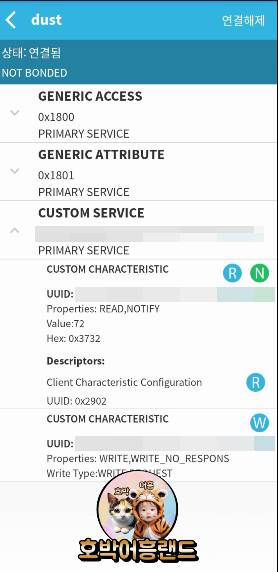
라즈베리파이 피코에서 BLE로 스마트폰과 통신하기기
April 8, 2025
Why Not WIFI 지난 시간에 라즈베리파이 피코를 아두이노 와이파이 모듈 처럼 사용하는 방법을 소개했었는데요. ...
더보기 →
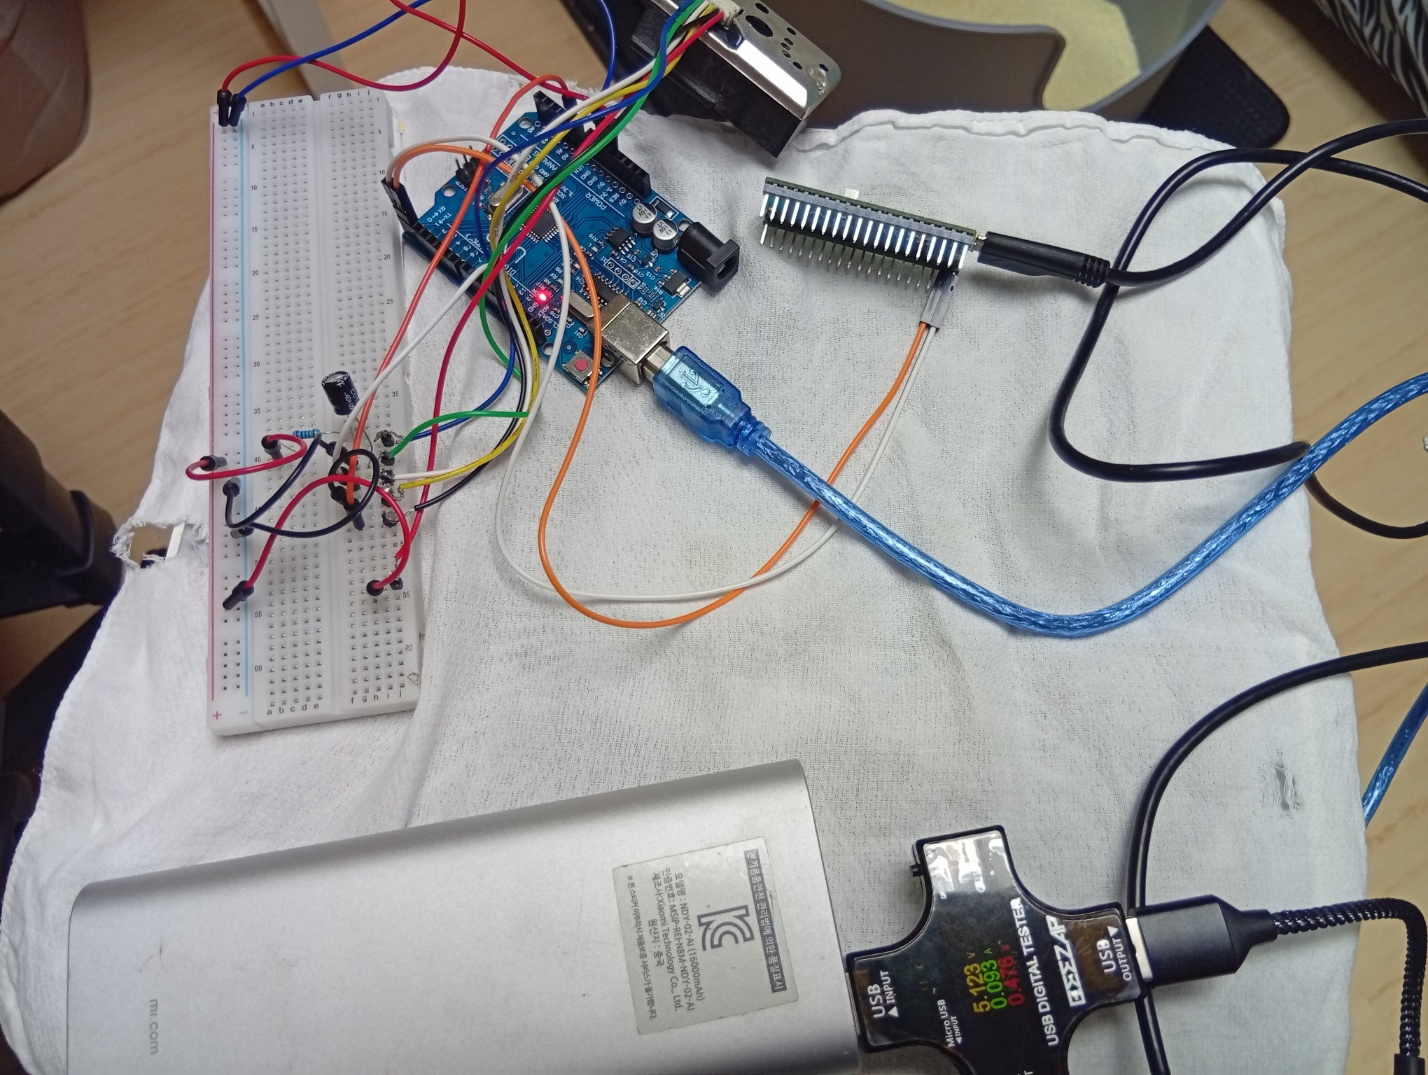
라즈베리파이 피코를 아두이노 와이파이 모듈 처럼 사용하기
March 15, 2025
미세먼지 측정하기 저희집 고양이 호박이 화장실 모래의 미세먼지를 측정한 적이 있습니다. 고양이 화장실 모래의 미세...
더보기 →
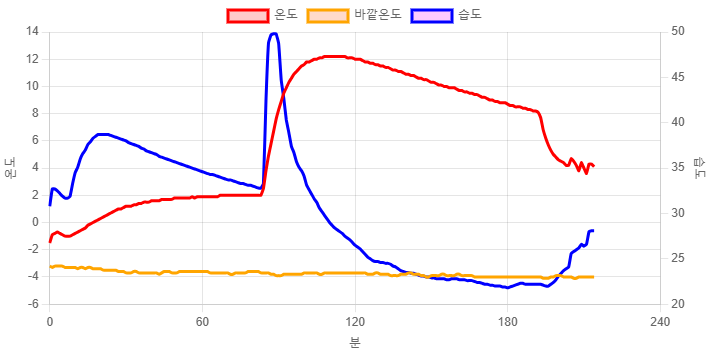
Next.js에서 chart.js를 이용해서 그래프 그리기
February 24, 2025
지난 시간에 이어서… 지난 시간에 라즈베리파이 피코로 실외에 있는 고양이 겨울집 내부의 온/습도를 측정한 다음, mqtt 통신을 통해...
더보기 →
Mosquitto와 라즈베리파이 피코를 이용해서 실외 온도 측정하기
February 17, 2025
라즈베리파이 피코 + DHT22(AM2320) 온습도 센서모듈 야외의 온도를 측정하기 위해서는 저전력 IoT 기술이 필요합니다. ...
더보기 →
Google STT와 Gemini를 이용해서 캘린더에 음성으로 스케쥴 추가하기
January 22, 2025
HeyMySec GitHub Respository 음성으로 구글 캘린더에 스케쥴을 입력할 수 있는 어플리케이션 입니다. Flu...
더보기 →
Flutter에서 느려지는 현상 없는 폴더선택 다이얼로그 만들기
November 22, 2024
요즘 스마트폰 용량이 TB급으로 늘어나면서, 사진을 찍어놓고 PC에 옮기지 않는 분들이 많을겁니다. 사진 폴더에 파일이 많다보니 ...
더보기 →
HEIC 파일을 JPG와 PNG로 변환해주는 프로그램
September 26, 2024
예전에 heic 파일 변환 관련한 코드를 이 블로그에 올린적이 있는데요. https://reddol18.pe.kr...
더보기 →
AWS API-GATEWAY에서 우리쪽 서버가 발생시킨 에러코드를 그대로 전달하는 방법
June 5, 2024
API-GATEWAY를 사용하다 보면 에러 응답 코드라던가, 응답 형식 등을 JSON으로 규정할 수 있음을 알 수 있습니다. 이러...
더보기 →
파이선에서 다른 가상환경을 이용하는 스크립트를 실행하기
May 17, 2024
종종 다른 의존성 라이브러리를 사용하는 파이선 코드를 또 다른 파이선 코드 내부에서 실행해야 하는 경우가 있습니다. 다음과 같은 ...
더보기 →
NodeJS 서버에서 애플 인앱결제 유효성 검증을 하는 방법
May 2, 2024
지난 시간에 구글 안드로이드 인앱결제 유효성 검증을 알아봤습니다. 오늘은 애플 아이폰용 앱에서 인앱결제를 했을 경우에, 결제정보의...
더보기 →
NodeJS 서버에서 안드로이드 인앱결제 유효성 검증을 하는 방법
April 30, 2024
구글 안드로이드용 앱에서 인앱결제를 했을 경우에, 결제정보가 리턴되는데요. 리턴된 값이 제대로된 값인지 혹시 위조된 것은 아닌지 ...
더보기 →
Flutter에서 google_sign_in 라이브러리 이용해서 캘린더 API 연동하기(1)
April 24, 2024
구글 캘린더 많이 사용하시나요? 저는 그것 만큼 직관적인 UI를 가진 스케쥴 앱을 못 찾겠더군요. 그래서 몇 년째 애용하고 있는데...
더보기 →
Posts navigation
← 이전
Page 2 of 6
다음 →